Diagrams in Pentest Reports

They say a picture is worth a thousand words. You can use diagrams in pentest reports. You don't have to an artist to pull that off. Use any free or commercial tool - like Google Slides, PowerPoint, Visio, Miro, Excalidraw, Diagrams.net, Draw.io, UML, XMind, etc.
Five rules to drawing diagrams
| Keep it high level |
Draw diagrams from a design standpoint. Not code-level. Not implementation-level. |
|---|---|
| Target non-technical people | Think of product managers with less technical-knowledge as your target audience. |
| Keep it simple | Don't try to convey too much information within a single diagram. Convey the bare-minimum idea. You are not replacing all texts in the report. You are just complementing it with a diagram. It's nearly impossible to please a technical-audience with a technical-diagram. Firstly, there are too many parameters - data flows, protocols, browsers, Internet, cloud provider, internet-service providers, mobile-service providers, browser, client-side code, server-side code, database, cache, load balancer. You are never going to be able to include all the information to make the diagram technically correct. The author of this article went down that rabbit hole. Secondly, a detailed, technically-correct diagram is going to be huge and defeats the purpose of the very reason we are drawing the diagram. Finally, our idea is to convey the idea quickly - so the reader should be able to get the idea within three-five seconds after looking at the diagram. |
| Keep it rough | Use imperfect icons, fonts, etc. Let them know that this is not a masterpiece diagram, but just a rough diagram to convey the idea. Drawing an aesthetically pleasing diagram is almost impossible with the short amount of time pentesters have. There are too many parameters to chase after including symmetry, alignment, distribution, color, size, branding, font-weight, and line-weight. |
| Accessibility | Don't exclusively rely on colours to convey an idea. There are an estimated 300 million people in the world with color vision deficiency. Instead, use text, patterns, shapes, and icons. |
Sample diagrams
| Auth Bypass - SQL injection | 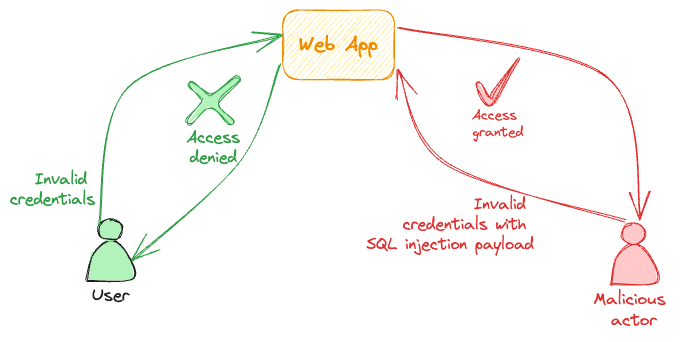 |
|---|---|
| Cross-site request forgery (CSRF) Unintended form submission |
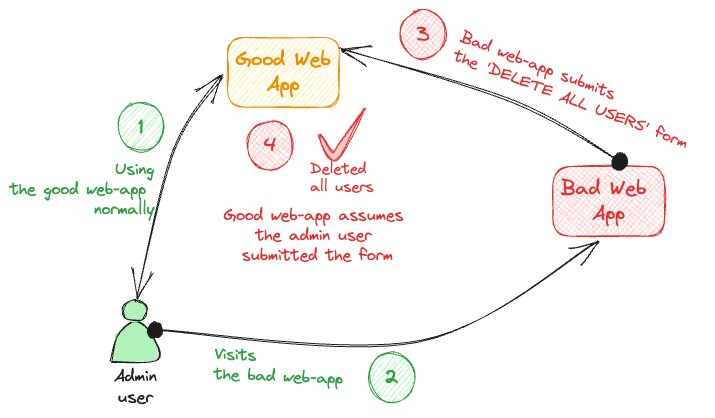 |
| Bruteforce attack Dictionary attack Password-guessing attack |
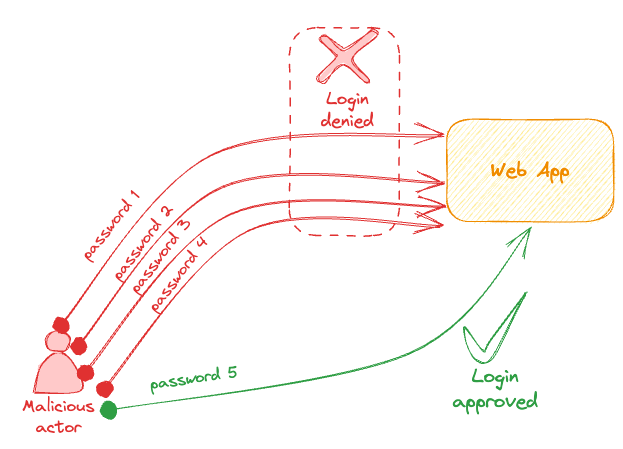 |